NEXRAD Radar Tutorial
How to Read Radar and Identify Severe Weather
Adapted from How to Spot Severe Weather by David A. Bottomley
What is NEXRAD Radar?
NEXRAD (Next-Generation Radar) is a network of 160 high-resolution Doppler weather radar stations jointly operated by the National Weather Service, Department of Defense, and FAA across the United States. Each station scans the atmosphere at multiple elevation angles, measuring how precipitation and other particles reflect and shift radar energy. This data is what you see on VectorWX when you load a local radar site.
VectorWX renders NEXRAD data at its native polar resolution — the same full-fidelity data that NWS meteorologists use to issue warnings. No downsampling, no approximation.
Reflectivity (dBZ)
Reflectivity is the primary radar product and shows the intensity of returned radar energy, measured in dBZ (decibels of Z). Higher values indicate denser or larger particles — heavy rain, hail, or dense moisture.
The color scale ranges from cool colors (blue/green, light rain) to warm colors (yellow/orange/red, heavy rain) to extreme values (pink/purple/white, which often indicate hail or extremely intense precipitation).
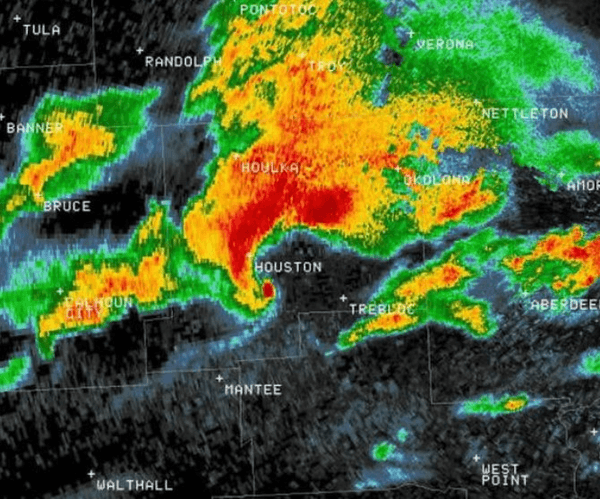
Key reflectivity thresholds to know:
- 20-35 dBZ — Light to moderate rain
- 35-50 dBZ — Heavy rain, possible small hail
- 50-60 dBZ — Very heavy rain, hail likely
- 60+ dBZ — Extreme precipitation, large hail probable
- 70+ dBZ — Giant hail, severe storm core
Velocity
Velocity shows the speed and direction of precipitation relative to the radar site using Doppler shift. Green indicates motion toward the radar, and red indicates motion away from the radar. A good way to remember: green means "go toward" the radar, red means it's "retreating."
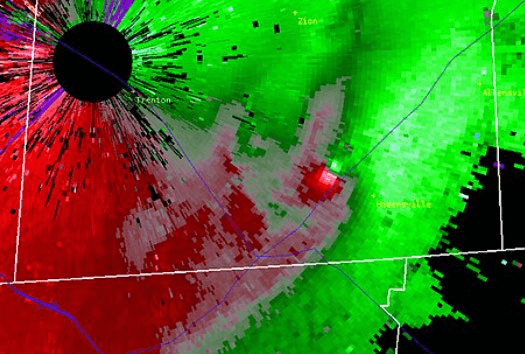
The key signature to look for on velocity is a velocity couplet — strong inbound (green) and outbound (red) velocities immediately adjacent to each other. This indicates rapid rotation within the storm. The tighter the gate-to-gate shear and the higher the velocities, the more intense the rotation.
If you see a red spot within a sea of green (or vice versa), that could indicate divergence, which could signal microbursts or straight-line wind damage.
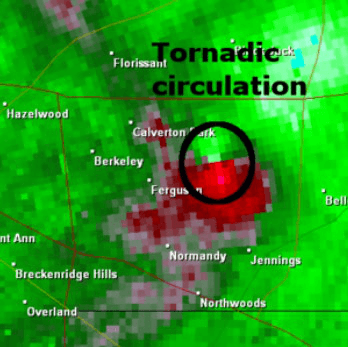
Storm-Relative Velocity (SRV)
Storm-Relative Velocity removes the overall storm motion from the velocity data, showing velocities relative to the storm itself rather than relative to the radar. This makes it easier to spot rotation, especially in fast-moving storms.
You're still looking for the same red-next-to-green couplets, but SRV often makes them more obvious because the background motion is removed.
Correlation Coefficient (CC)
Correlation Coefficient measures how uniform the radar return is. High CC values (0.95-1.0) indicate uniform precipitation like rain or snow. Lower values indicate a mix of particle types or sizes.
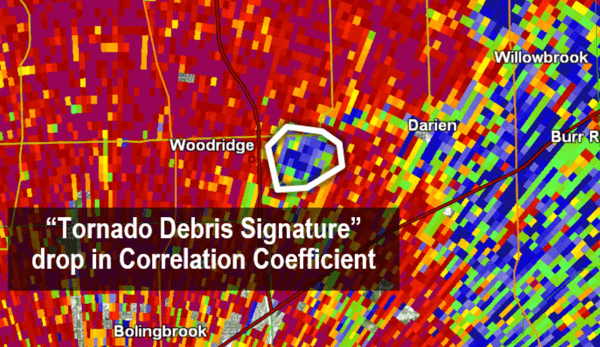
A sudden drop in CC within a storm — especially when collocated with a velocity couplet — is a Tornado Debris Signature (TDS). This means a tornado is on the ground and lofting debris into the air. This is one of the most definitive radar confirmations of a tornado.
Other Radar Products
Spectrum Width (SW) measures the variability of velocities within a radar pulse. High spectrum width values indicate turbulence — useful for identifying areas of severe turbulence within storms.
Differential Reflectivity (ZDR) compares horizontal vs vertical echo returns, helping distinguish rain drops (which are wider than tall) from hail (roughly spherical) or snow.
Composite Reflectivity (CompRef) shows the maximum reflectivity across all radar elevation tilts — giving you the strongest echo at any altitude in a single view.
Vertically Integrated Liquid (VIL) estimates the total liquid water content in a vertical column. High VIL values indicate strong updrafts and potential for large hail.
Echo Tops (ET) shows the height of the highest radar echo above ~18 dBZ. Taller storms are generally more intense and have stronger updrafts.
Storm Types
Single-cell thunderstorms are the most common type — short-lived storms that pop up when conditions are favorable. They rarely produce severe weather.
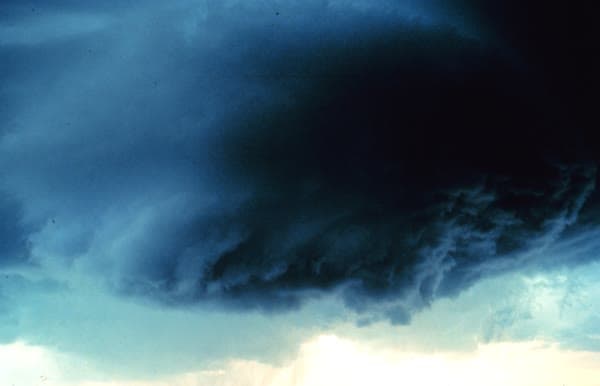
Supercells are long-lived, highly organized storms with a rotating updraft (mesocyclone). They produce the most violent tornadoes, largest hail, and strongest winds. On radar, look for a hook echo on reflectivity and a velocity couplet on velocity.
Squall lines are groups of storms arranged in a line. They produce damaging straight-line winds and occasionally brief tornadoes. A bow echo — where the line bows outward — indicates particularly strong winds at the apex.
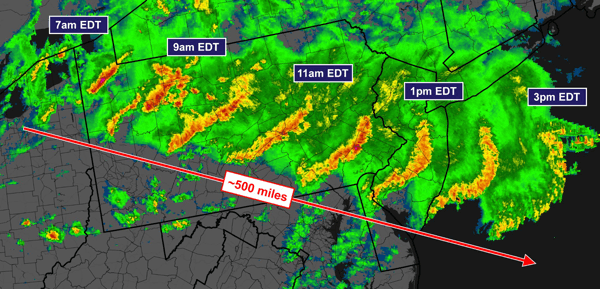
A derecho is an extreme version of a squall line producing a swath of wind damage extending more than 400 miles with several well-separated gusts of 75+ mph.
Identifying Tornadoes on Radar
To identify a potential tornado on radar, follow this sequence:
- Reflectivity: Look for a hook echo — a curved appendage on the south or southeast side of a supercell.
- Velocity: Switch to velocity or storm-relative velocity and look for a tight couplet of green (inbound) and red (outbound) at the tip of the hook.
- Correlation Coefficient: Check for a drop in CC at the location of the velocity couplet — a debris ball confirms a tornado is on the ground.
- Multiple tilts: Check higher elevation angles to verify the rotation extends vertically through the storm (vertical continuity). A Tornado Vortex Signature (TVS) shows rotation at multiple levels.
Remember: a tornado can be rain-wrapped and invisible on reflectivity alone. Always check velocity for rotation signatures.
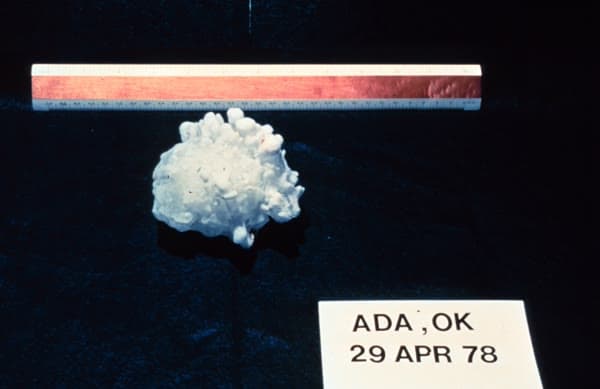
Identifying Hail on Radar
Hail forms when strong updrafts carry water droplets into the freezing upper atmosphere, building layers of ice. Key indicators:
- Reflectivity 50-60+ dBZ — Red, purple, or white cores indicate large, dense particles
- High VIL values — Compact areas of elevated VIL suggest strong updrafts supporting hail growth
- Reduced CC (0.90-0.97) within high reflectivity — Mixed particle sizes (rain + hail) lower the correlation coefficient compared to pure rain (>0.98)
- Three Body Scatter Spike (TBSS) — A spike of low reflectivity extending away from the radar behind a high-reflectivity core indicates giant hail
Using VectorWX Radar
VectorWX provides all the radar products discussed above through our NEXRAD radar viewer:
- Product buttons at the top let you switch between Reflect, Velocity, RelVel (Storm-Relative), SpecW (Spectrum Width), CC (Correlation Coefficient), DiffRef (Differential Reflectivity), DiffPh (Differential Phase), CompRef (Composite Reflectivity), VIL (Vertically Integrated Liquid), and EchoTop
- Tilt selector changes the elevation angle to look at different heights in the storm
- Animation plays back recent scans to show storm motion and evolution
- LIVE mode (PRO) streams radar updates in real-time as the radar scans
- Dual-Pane mode lets you compare two products side by side — ideal for viewing Reflect and Velocity simultaneously
- Alerts overlay shows NWS warning polygons directly on the radar map
Click on the map to sample exact values at any point, and use the gate-to-gate measurement on velocity to measure wind shear across a couplet.
Key Takeaways
- Don't rely solely on official warnings — learn to read radar yourself
- Always check multiple products: reflectivity alone won't show you everything
- A velocity couplet + hook echo + CC drop = high-confidence tornado detection
- Storm-Relative Velocity makes rotation easier to spot in fast-moving storms
- High VIL + high reflectivity = hail threat
- Bow echoes and derechos produce extreme straight-line winds
- Track storms in real-time using VectorWX's LIVE mode and animation features
Content adapted from How to Spot Severe Weather and Keep Your Family Safe by David A. Bottomley.
Copyright 2025. All rights reserved.